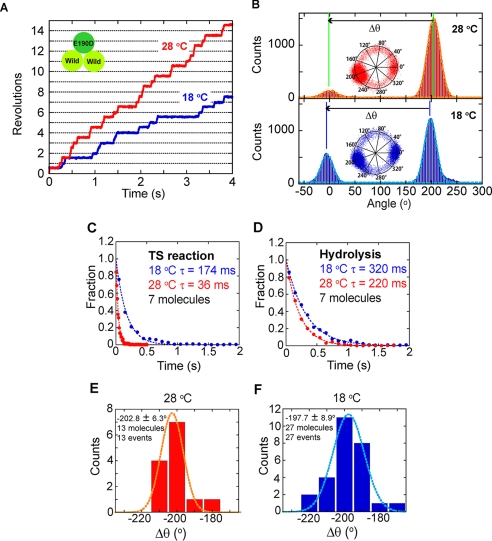
FIGURE 4.
A, time courses of the rotation of a molecule of the hybrid F1, α3β2β(E190D)γ, at 18 °C (blue) and 28 °C (red). The specimen temperature was first set at 28 °C and changed to 18 °C during the observation. B, histograms of the angle from traces in A. The inset shows the centroid of the rotation. Δθ represents the angle distances of TS pause from the hydrolysis pause. C and D, dwell time histograms of the pause of the TS reaction (C) and hydrolysis (D). Blue and red circles show the histogram at 18 and 28 °C, respectively. The histogram was fitted with single exponential decay. E and F, histogram of Δθat 28 °C (E) and 18 °C (F).

