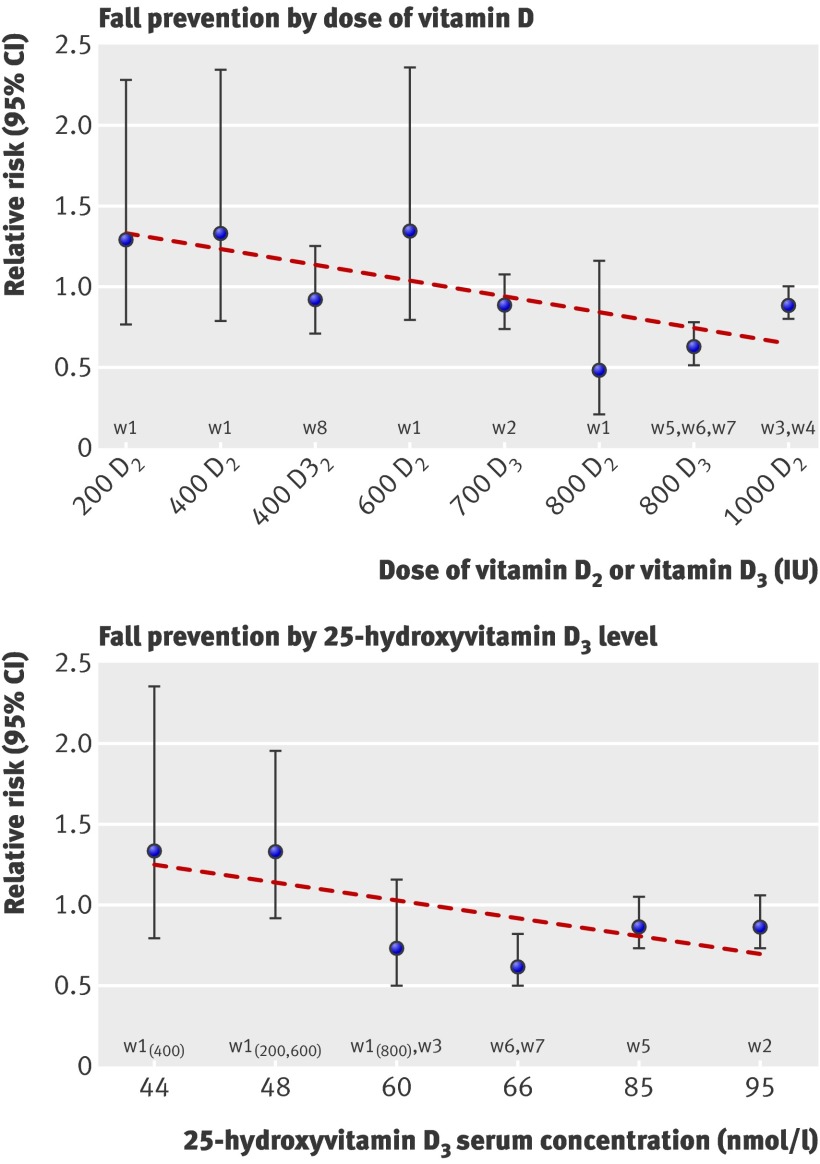
Fig 3 Fall prevention by dose and achieved 25(OH)D concentrations. Circles represent relative risks and error bars represent 95% confidence intervals. Trendline is based on series of effect sizes (circles). There were three trials with 800 IU D3,w5 w6 w7 so the effect size for 800 IU D3 is the pooled result from these three trials. Likewise, the effect size for 1000 IU D2 is the pooled result from the two trials with 1000 IU D2.w3 w4 We have listed the same dose D2 and D3 separately in the graph to account for their potential different impact on fall reduction. As there were two data points from the Broe et al trial that reached 48 nmol/l,w1 two trials that reached 60 nmol/l,w1 w3 and two trials that reached 66 nmol/l,w6 w7 we pooled each of the sets. On the basis of visual inspection of figure 3, the benefits of vitamin D for fall risk started at a dose of 700 IU a day

An official website of the United States government
Here's how you know
Official websites use .gov
A
.gov website belongs to an official
government organization in the United States.
Secure .gov websites use HTTPS
A lock (
) or https:// means you've safely
connected to the .gov website. Share sensitive
information only on official, secure websites.
