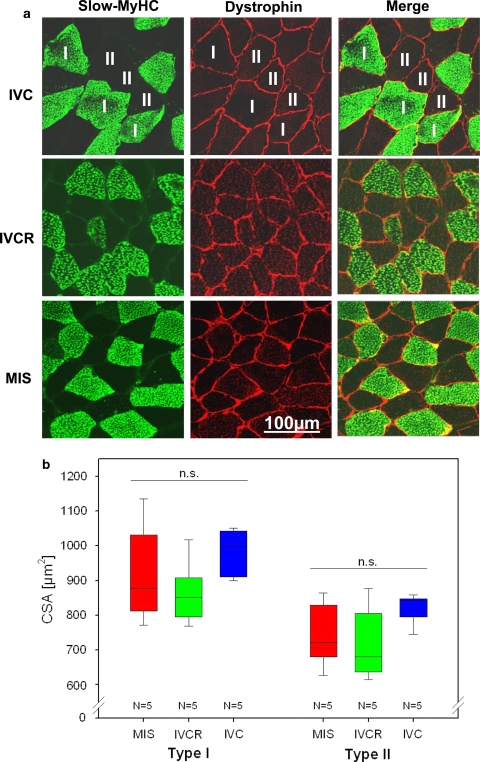
Fig. 1.
Determination of the cross-sectional area (CSA) in mouse soleus following IVC, IVCR and MIS housing. a Confocal images showing immunofluorescence double staining of soleus muscle fibres with the slow MyHC marker (myofibres I, green) and the membrane marker dystrophin (red). b Statistical analysis of cross-sectional area (CSA) of soleus myofibre type I and II of MIS, IVCR and IVC mice. Data are given as box plots showing medians (lines in the boxes), 25 and 75% percentiles (boxes) as well as 10 and 90% percentiles (whiskers). No significant changes were determined in the CSA of slow-type (I) or fast type (II) myofibres between either groups. IVC group (n = 5), IVCR = 50% reduced area cage group (n = 5), MIS ‘Mice in Space’ group (n = 5). KWH test, df = 2; CSA cross-sectional area (μm2), Bar 100 μm (a)

