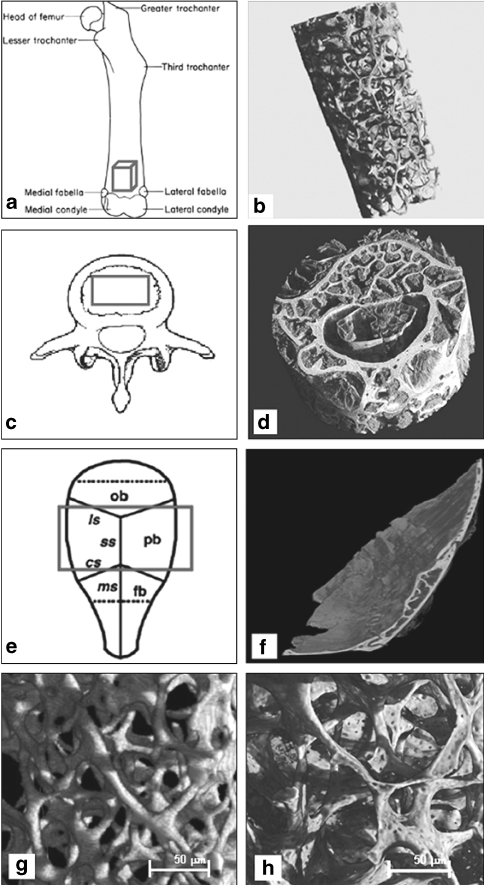
Fig. 3.
Bone 3-D microarchitecture analysis performed by synchrotron micro-computed tomography (μCT). The regions of interests (ROIs) are indicated in red cubes in lefthand panels (a) femur, (c) lumbar spine, and (e) parietal bone. The reconstructed 3-D images are shown in righthand panels (b), (d), and (f). g–h Reconstructed 3-D images of femurs showing low resolution (>9 μm) of the trabecular pores by the ELETTRA—SYRMEP (g), and higher resolution (<5–8 μm) of trabecular pores by the ESRF-BM05 (h)

