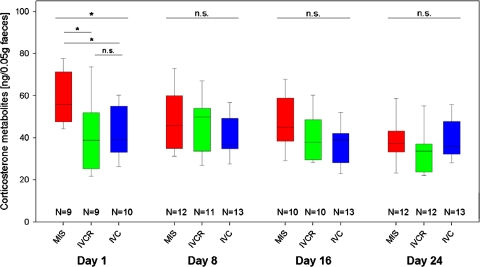
Fig. 5.
Time course (day 1–8–16–24) of faecal corticosterone metabolite (CM) concentrations in collected faeces of mice kept in the MIS (red), IVCR (green), and the IVC (blue) housing system, respectively. Data are given as box plots showing medians (lines in the boxes), 25 and 75% percentiles (boxes) as well as 10 and 90% percentiles (whiskers). The variable n numbers are due to unusual waste filter sedimentation that sometimes impaired the collection of faeces material from MIS cages. Statistically significant differences between the groups (KWH test and post hoc MWU tests) are indicated by asterisks (P > 0.1 n.s., P < 0.05*; for details see text)

