Fig. 9.
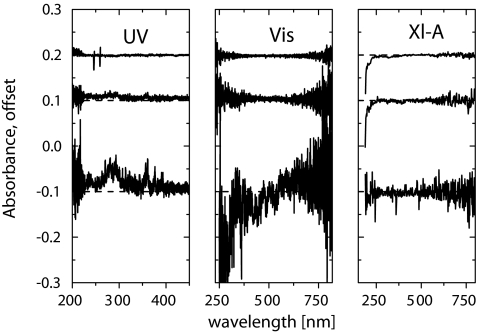
Noise comparison between the XL-A and the MWL-AUC. Spectra were taken with 1/10/100 point averaging, shown as the bottom/middle/top spectrum, respectively. Dotted horizontal lines indicate the offset true baselines. Due to the higher point density for the USB2000 spectrometers, the spectra appear broader as they are in reality. Note the differences in scale of the abscissae. The respective statistical data are: UV(1), −0.016 ± 0.029; UV(10), 0.007 ± 0.009; UV(100), 0.001 ± 0.005; Vis(1), −0.011 ± 0.059; Vis(10), 0.004 ± 0.010; Vis(100), −0.002 ± 0.003; XL-A(1), −0.003 ± 0.017; XL-A(10), −0.001 ± 0.006; XL-A(100), −0.002 ± 0.004. UV scanned 200–500 nm; Vis scanned 250–800 nm, and XL-I scanned 200–800 nm

