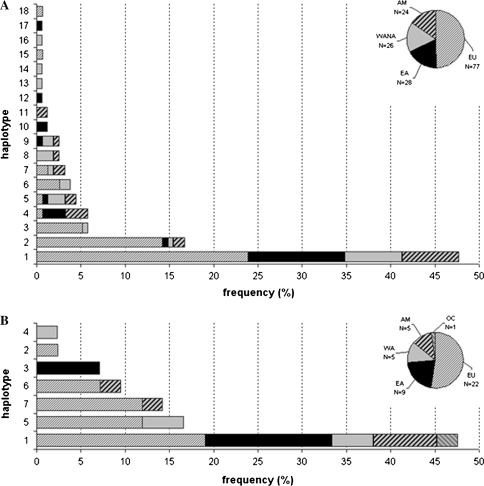
Fig. 3.
Haplotype frequencies of the GAMYB gene in barley (a) and wheat B-genome (b). Pie charts show the composition of each germplasm with numbers (N) of accessions per geographical origin. The origins are symbolised by different patterns as shown in the key (AM America, EA East Asia, EU Europe, OC Oceania, WA West Asia only, WANA West Asia and North Africa)

