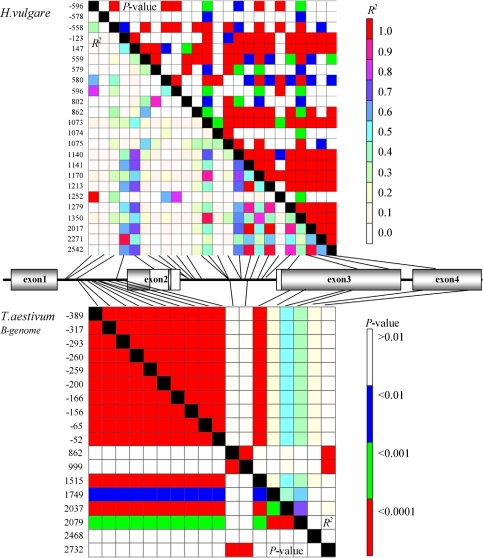
Fig. 4.
Linkage disequilibrium matrix for SNPs within GAMYB in H. vulgare (top) and T. aestivum B-genome (bottom). SNPs with a minor allele frequency below 5% were not included. Polymorphic sites are plotted on the x-axis and y-axis. Pairwise comparison values of linkage disequilibrium are displayed as R² and the corresponding P values for Fisher’s exact test are given. The structure of the gene is shown between the two heat plots. Black lines indicate the positions of SNPs in the gene; open boxes indicate the functional MYB domain

