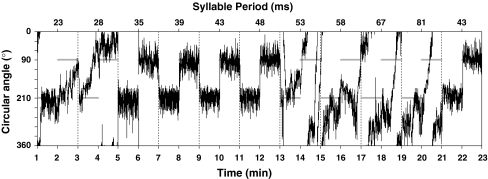
Fig. 1.
Trace diagram of a female’s movement during quantification of her preference response to different syllable periods. Each stimulus was played back for a duration of one minute per speaker from two different speakers; speaker 1 was situated at 210° and speaker 2 at 90°. Horizontal grey lines show the active speaker. Notice how the female does not respond to syllable periods >48 ms but resumes phonotaxis at the final stimulus (STD2 stimulus; syllable period = 43 ms)

