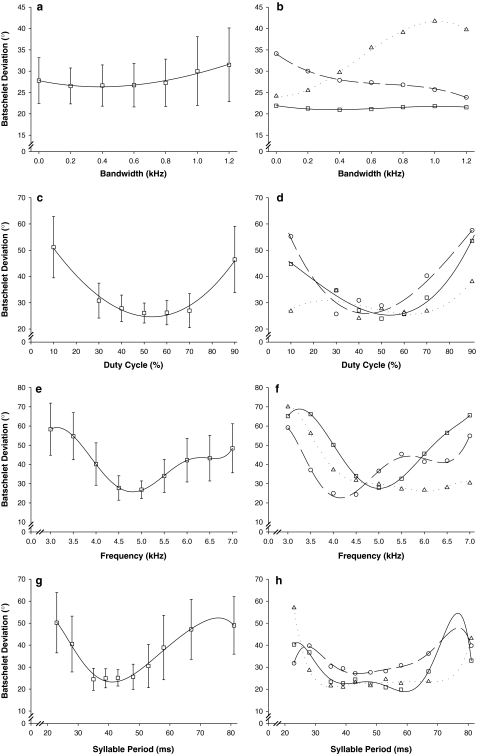
Fig. 5.
Female response functions for four different calling song parameters for the field cricket, G. bimaculatus. Population level phonotactic response (mean Batschelet deviation ± SD) for 130 females (Experiment 1) is shown for the bandwidth (BW), duty cycle (DC), frequency (FQ) and syllable period (SP) trials in the left figures. The polynomial regression generated from the population ŷ values, obtained from cubic spline analysis is presented as the solid black line. For each trial, figures on the right show the individual phonotactic response of three different females demonstrating significant between-individual differences. Values are ŷ values, obtained from cubic spline analysis with the corresponding polynomial regression. Symbol and line legends are the same for each trial where each female’s individual response is represented with a square, circle or triangle symbol and her corresponding polynomial regression is indicated respectively with a line that is solid, dashed or dotted

