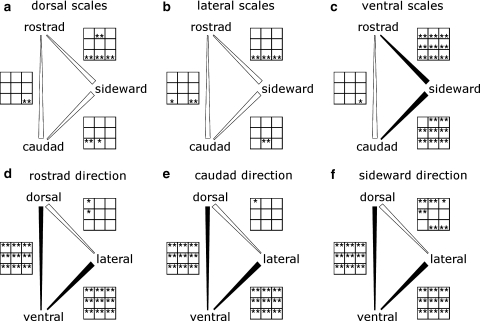
Fig. 4.
Comparison of friction coefficients estimated in different sliding directions (a–c) and of scales from different body regions (d–f). Broad end of the connecting line indicates where significantly higher coefficients of friction were found more often on the nine different roughnesses. Filled connections are used when one direction (or body region) has significantly higher friction coefficients on the majority of the nine roughnesses (94 and 100% in these cases). Open connections indicate that half or less of the roughnesses have significantly higher friction coefficients. The asterisks in the panels next to the connecting lines show the levels of significance for the nine roughnesses. (first row 0.08, 0.25, and 0.42 μm; second row 1.11, 2.26, and 2.75 μm; third row 12.67 and 13.94 μm, and replication of P60 sandpaper; no asteriskP ≥ 0.05, *0.01 < P < 0.05, **P < 0.01). Asterisks at the top of box indicate that the friction coefficient of the direction (or body region) at the upper tip of the comparison bar is significantly higher at the corresponding roughness

