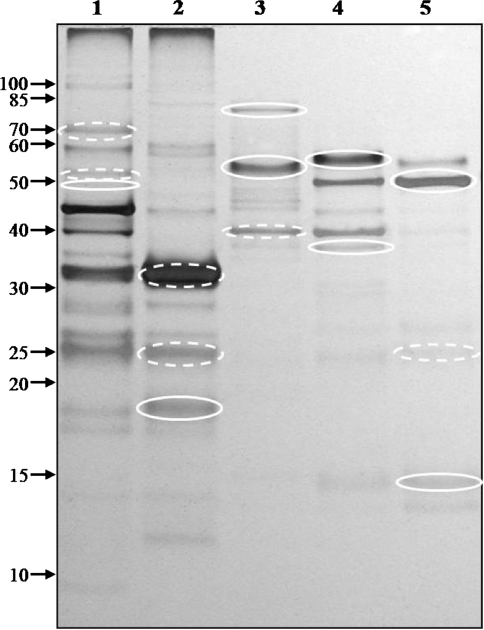
Fig. 2.
Membrane samples of I. hospitalis, solubilized with 0.5% DDM, separated by gel filtration, analyzed by SDS-PAGE and stained with Coomassie. Numbers on the left indicate relative molecular masses (kDa). Numbers on top are arbitrary fraction numbers of the gel filtration chromatography. The white ellipsoids indicate samples further analyzed by N-terminal sequencing and/or mass spectrometry. Solid white lines indicate proteins which were newly identified; broken lines indicate proteins which had already been identified

