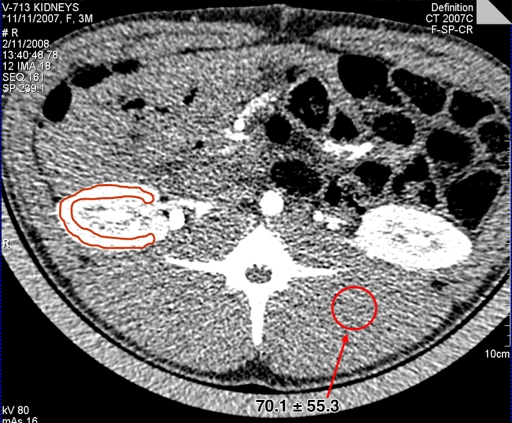
Figure 1b:
Renal perfusion CT images obtained with (a) routine dose level (80 kV, 160 mAs), (b) one-tenth dose level (80 kV, 16 mAs), and (c) HYPR-LR–processed one-tenth dose level. Means and standard deviations of CT numbers at a selected ROI (arrow) in the back muscles are also shown. The highlighted renal contour is the region of the renal cortex.

