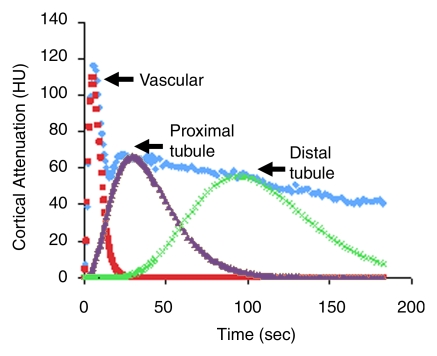
Figure 2a:
Representative cortical TACs obtained in one pig by using (a) the routine radiation dose level and (b) the one-tenth dose level with HYPR-LR processing. The renal cortical TAC exhibited three sequential peaks, representing displacement of the contrast material bolus along the cortical vascular compartment, proximal tubule, and distal tubule, as inferred from the timing, sequence, and location of the peaks. TACs obtained with the routine dose images and the one-tenth dose HYPR-LR–processed images were qualitatively similar in shape.

