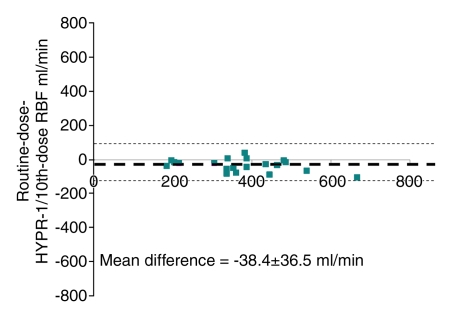
Figure 4c:
(a, b) Correlation and (c, d) Bland-Altman plots describe the relationship between the routine dose and the one-tenth dose HYPR-LR–processed images. The CT values of (a, c) RBF and (b, d) GFR were obtained in basal conditions. In c and d, dotted line = mean difference, and dashed lines = 2 standard deviations of the mean.

