FIGURE 3.
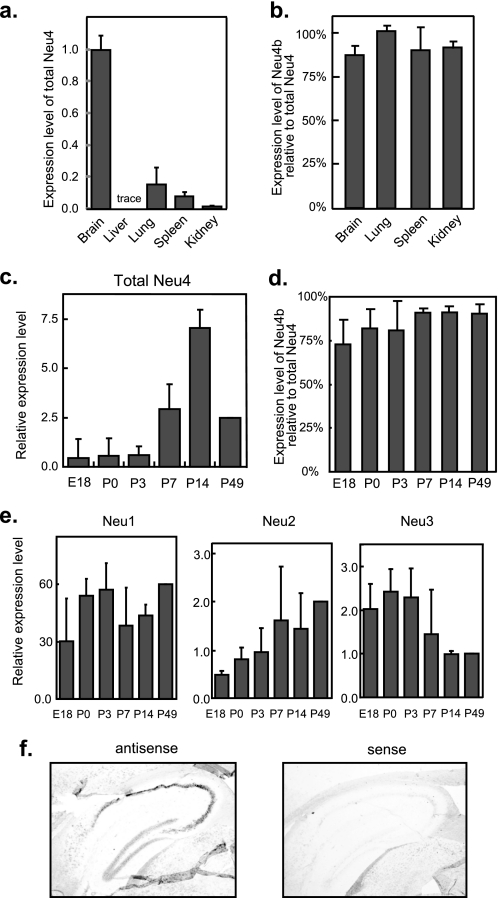
Neu4 expression in murine tissues. a, expression levels of Neu4 gene in murine tissues, as estimated by quantitative RT-PCR. The expression of β-actin was also examined as an internal reference. b, relative expression of the short form (Neu4b) compared with the total Neu4 level is shown. c, expression profile of the Neu4 gene in developing mouse brain determined by quantitative RT-PCR. E18, embryonic day 18; P0, P3, P7, P14, and P49, postnatal days 0, 3, 7, 14, and 49. Total Neu4 mRNA levels were expressed relative to the P49 mouse value. d, ratios of Neu4b to total Neu4 during the brain development. e, relative Neu1, Neu2, and Neu3 levels in the developing brain mouse. The data given are mean values from three experiments ± S.D. In c and e, quantities of the transcripts encoding Neu4 and other murine sialidases were determined by standard curves obtained from plasmids containing respective sialidase cDNAs as described under “Experimental Procedures.” The values are based on the assumption that the efficiency in PCR is apparently comparable among these sialidase genes. f, frozen parasaggital sections of a C57BL/6J mouse brain were hybridized with digoxigenin-labeled Neu4 antisense and sense RNAs. Note positive signals in the hippocampus.

