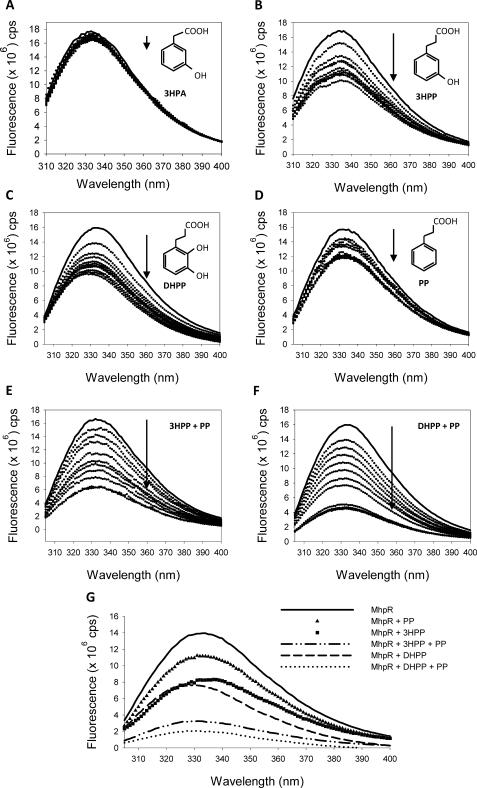
FIGURE 6.
Quenching of intrinsic fluorescence of MhpR-His by different ligands. Fluorescence emission spectra of MhpR-His (0.5 μm) in the presence of increasing concentrations (from 10 to 100 μm) of 3HPA, used as negative control (A), 3HPP (B), DHPP (C), PP (D), 3HPP and PP (E), and DHPP and PP (F). The solid and dotted curves represent the spectra recorded in the absence and presence of increasing concentrations of ligand, respectively. The arrows show the decrease of the fluorescence. G, comparison of the fluorescence decrease caused by the addition of 3HPP, PP, or DHPP in excess (100 μm) with the decrease provided by the previous addition of PP at saturating concentration (100 μm) and the posterior addition of 3HPP or DHPP.

