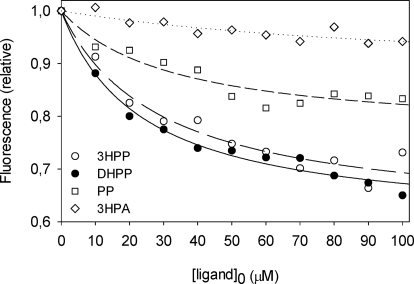
FIGURE 7.
Quenching of MhpR-His (0.5 μm) tryptophan fluorescence as a function of ligand concentration at pH 7.5. Data points represent the decrease at the emission maximum in the presence of 3HPA used as a negative control (open diamonds), PP (open squares), 3HPP (open circles), and DHPP (closed circles). The curves through the data points were generated using Equation 1.

