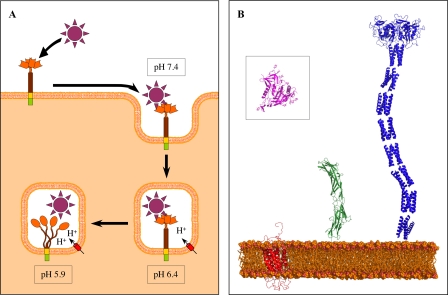
FIGURE 10.
DC-SIGN cell-surface presentation and internalization model. A, a working hypothesis describing the dynamics of a DC-SIGN-ligand complex upon internalization and subsequent pH decrease. This model proposes that the DC-SIGN-ligand pathogen complex internalized at pH 7.4 resists to mild acidification at pH 6.4 (early endosomes) and subsequently dissociates at a pH around 5.9 (late endosomes) due to both DC-SIGN chain separation and CRD structure alteration. B, relative size comparison of the structure of the HIV gp120 (outlined in pink into black square) and of its different receptors (DC-SIGN is outlined in blue, CD4 in green, and CCR5 in red). Because no structure is available for CCR5, we used the molecular model (PDB code 1nd8).

