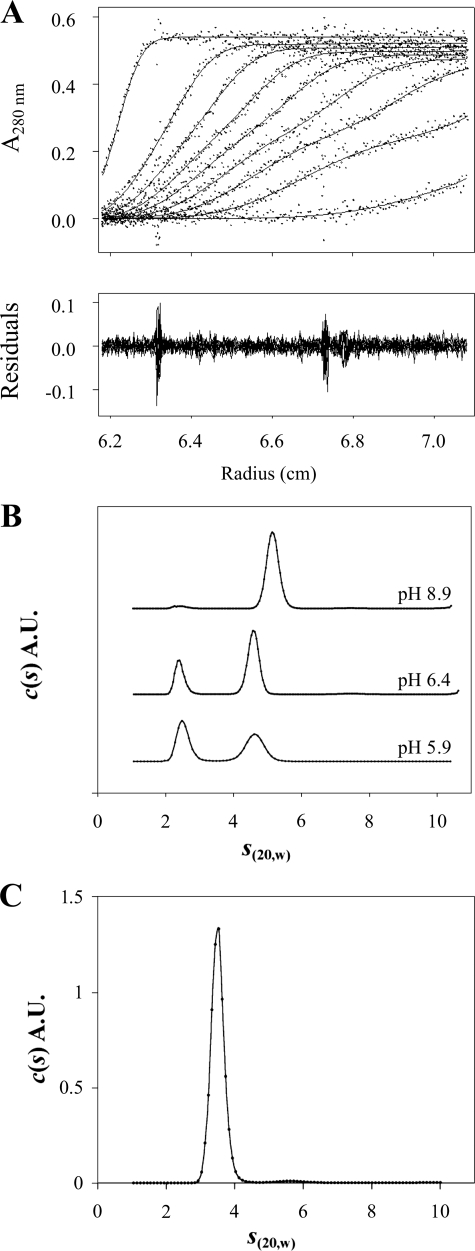
FIGURE 4.
Analytical ultracentrifugation analysis of the DC-SIGN-derived oligomeric species in solution as a function of pH. A, DC-SIGN ECD (7 μm) velocity sedimentation profiles obtained using absorbance optics. Superimposition of experimental sedimentation profiles and fitting curves from the c(s) analysis using SEDFIT (upper panel). B, DC-SIGN ECD c(s) velocity sedimentation analysis at different pH values using absorbance optics. All experiments were performed at 7 μm protein and 20 °C and the chosen pH values were 8.9, 6.4, and 5.9. c(s) distributions are displayed on the same scale. C, DC-SIGN Neck c(s) velocity sedimentation analysis of the profiles recorded in 25 mm Tris HCl buffer, pH 8.9, 150 mm NaCl, at 20 °C.

