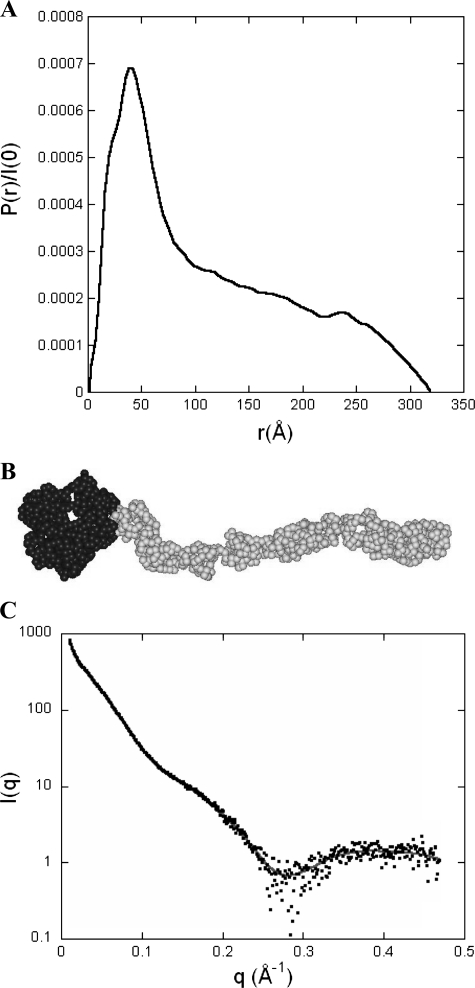
FIGURE 7.
Pair distribution function P(r) and ab initio model of DC-SIGN ECD. A, the pair (or distance) distribution function P(r) was computed from the scattering intensity I(q) using the program GNOM. The profile is characteristic of a very elongated object such as a long and thin cylinder. B, DC-SIGN model obtained using the ab initio modeling program GASBOR that represents the protein as a chain of dummy residues, one per amino acid residue in the protein, centered at the Cα positions. The volume of the spherical dummy residue is the average volume of amino acid residues. The 608 dummy residues corresponding to the 4 CRDs are colored black, whereas the 748 dummy residues describing the neck are colored gray. C, calculated scattering pattern of the GASBOR model shown above (gray continuous line) superimposed onto the experimental scattering intensity curve (black dots).

