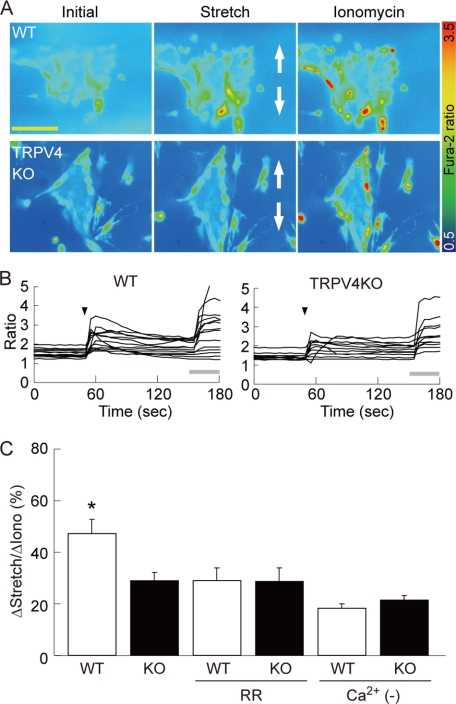
FIGURE 4.
Ca2+ responses to stretch stimulation in primary urothelial cell cultures. A, [Ca2+]i increases upon stretch stimulation by STREX in wild-type (WT) urothelial cells (upper panels), but the response is poor in TRPV4-deficient (TRPV4KO) cells (lower panels). All images were taken from cells seeded on the 1-mm slit area in the stretch chamber (refer to supplemental Fig. S1). The stretch speed was 400 μm/s, and the distance was 500 μm. Cells were extended to a vertical axis (indicated by arrows) in both cell types. Scale bars: 100 μm. B, quantification of [Ca2+]i changes in individual cells. Stretch evokes transient [Ca2+]i increases in WT cells, whereas only small and sustained [Ca2+]i increases are observed in TRPV4KO cells. All traces were obtained from the cells shown in A both in WT and TRPV4KO cells. Black arrowheads denote the onset of stretch. Gray bars: 5 μm ionomycin application. C, the average peak of [Ca2+]i increases is significantly reduced in TRPV4KO (KO) urothelium upon stretching. Ruthenium red (RR, 10 μm) attenuates the stretch-evoked [Ca2+]i increase in WT cells to the level achieved in TRPV4KO cells without RR treatment, but shows no effect on TRPV4KO cells. [Ca2+]i increases are similar between WT and TRPV4KO cells in the absence of extracellular Ca2+ (Ca2+ (−)). All the data are normalized to the values induced by 5 μm ionomycin application as 100% and presented as means ± S.E. (n > 7). An asterisk indicates significant difference between WT and the other five groups. *, p < 0.05 (Fisher's protected least significant difference).

