FIGURE 4.
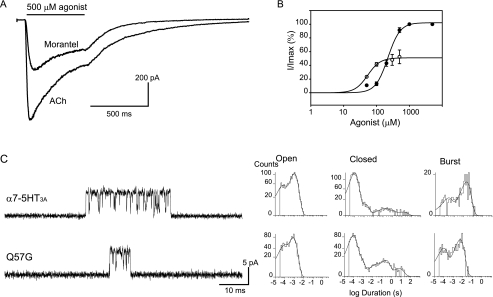
Activation by morantel of α 7–5HT 3A receptors carrying the mutation Q57G. A, whole cell currents recorded from BOSC cells expressing Q57G mutants in response to 500 μm ACh or morantel. Membrane potential, −50 mV. B, dose-response curves for ACh (●) and morantel (○). Each point is an average of three to five determinations with the error bars representing the S.D. Curves are fits to the Hill equation. C, left, channels were recorded in the presence of 20 μm morantel. Right, open, closed, and burst duration histograms corresponding to wild-type and mutant α7-5HT3A. Membrane potential, −70 mV.

