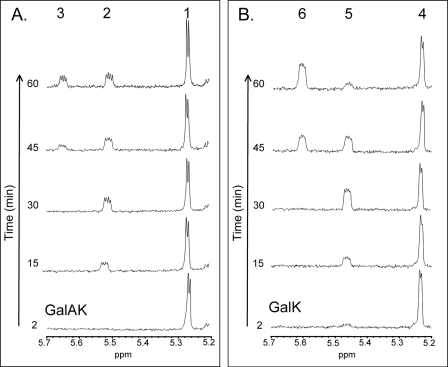
FIGURE 4.
Real- t ime 1 H NMR - based GalAK and GalK assays. Individual enzyme (GalK or GalAK) was mixed with sugar (Gal or GalA), buffer, and ATP, and the reaction was placed in an NMR tube. Approximately 2 min after enzyme addition and NMR shimming, NMR data were collected (bottom trace). Progressions of enzyme activity at 15 and 30 min are shown. At 30 min, UTP and Sloppy were added to the NMR tube, and the NMR spectra were continued to be collected. The sugar anomeric region of the 1H NMR spectrum is shown. A: NMR peak annotations of coupled GalAK-Sloppy assay are: peak 1, α-GalA at 5.27 ppm; peak 2, α-GalA-1-P at 5.52 ppm; and peak 3, UDP-α-GalA at 5.65 ppm. B: NMR peak annotations of coupled GalK-Sloppy assay are: peak 4, α-Gal, at 5.24 ppm; peak 5, α-Gal-1-P at 5.47 ppm; and peak 6, UDP-α-Gal at 5.61 ppm.

