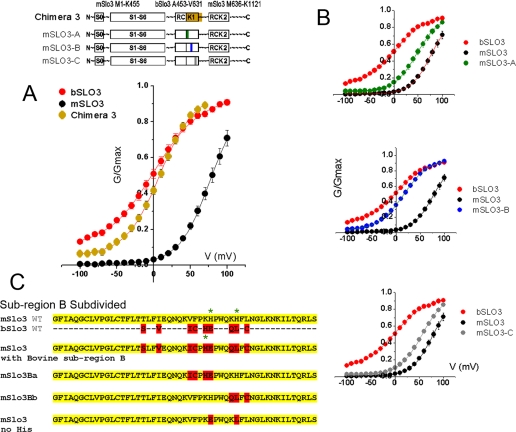
FIGURE 5.
A small region in the distal part of the RCK1 domain has the most dramatic effect in changing the voltage range of activation of mSLO3 channels. A, G-V curve obtained from expression of chimera 3 compared with wild type G-V curves shows a G-V relation substantially shifted to negative values. Chimera 3 is a mSLO3-based construct containing only the distal half of RCK1 from bSLO3. Boltzmann fit of the chimera 3 G-V curve gave V½ and k values of +8.9 ± 1.98 mV and 23.97 ± 1.3 (n = 11), respectively. B, the small bSLO3 sequence in chimera 3 was subdivided and incorporated into three constructs, mSLO-A, mSLO3-B, and mSLO3-C. G-V relationships are shown for mSLO-A, mSLO3-B, and mSLO3-C chimeras. Their respective V½ parameters are 47 ± 3.15, 16.2 ± 1.42, and 56.1 ± 2.3 mV, and their respective k parameters are 23.5 ± 1.73, 26.5 ± 0.98, and 23.6 ± 0.91 (n = 12, 19, and 11) (means ± S.E.). The mSLO3-B G-V curve substantially resembled that of wild type bSLO3 with regard to its voltage parameters. C, subregion B was further subdivided. Using the mSLO3 wild type template, we incorporated four of the upstream residues of bovine subregion B to create mSLO3-Ba and three of the downstream bovine subregion B residues to create mSLO3-Bb. The respective V½ values of activation of these constructs are 42.4 ± 4.7 and 28.8 ± 1.5 mV, and the respective k values are 34.1 ± 2.5 and 30.2 ± 1.2 for mSLO3-Ba (n = 7) and mSLO3-Bb (n = 8). The sequence at the bottom shows the sequence of mSLO3 where two histidine residues have been replaced by the corresponding residues present in bSLO3. As shown in Fig. 6, the replacement of the histidine residues had no effect on the pH sensitivity of mSLO3 channels.

