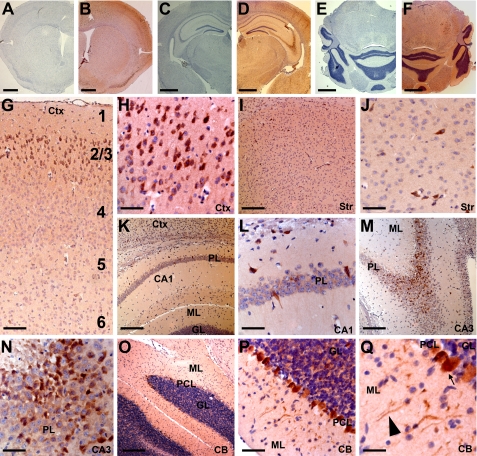
FIGURE 3.
Immunohistochemical analysis of printor protein distribution in mouse brain. Coronal sections through striatum (A and B), hippocampus (C and D), and cerebellum (E and F) were immunostained with either anti-printor antibody (B, D, and F) or no primary antibody (A, C, and E) and counterstained with hematoxylin. G and H, printor immunostaining in the cortex (Ctx). Numbers indicate cortical layers. Neurons in the layers 2–3 were strongly stained. I and J, printor immunostaining in the striatum (Str). K and L, printor immunostaining in the hippocampal CA1 region. Printor immunoreactivity was seen in the pyramidal layer (PL) but not in the molecular (ML) or granular (GL) layers. M and N, printor immunostaining in the hippocampal CA3 region. Printor immunoreactivity was found in the PL but not in the ML. O–Q, printor immunostaining in the cerebellum (CB). Purkinje cell layer (PCL) neurons display intense immunostaining compared with the granular layer (GL). Purkinje cell projections in the molecular layer were also labeled. Arrow indicates cell body and the arrowhead indicates neuronal projection. Scale bar is 1.25 mm in A-F; 125 μm in G; 250 μm in I, K, M, and O; 60 μm in H, J, L, N, and P; 30 μm in Q.

