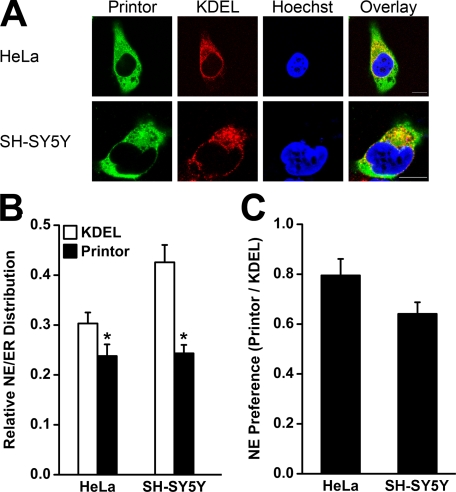
FIGURE 7.
Printor displays ER preference in both HeLa and SH-SY5Y cells. A, HeLa (top) or SH-SY5Y (bottom) cells expressing Myc-tagged printor were stained with primary antibodies against Myc and ER marker KDEL, followed by detection with secondary antibodies conjugated to Texas Red (KDEL, red) or FITC (printor, green). Hoechst stain was used to visualize the nucleus. Scale bars, 10 μm. B, quantification shows the relative distribution of printor and KDEL in the NE versus the ER. Data represent mean ± S.E. (error bars) from at least three independent experiments. *, significantly different from the NE/ER ratio of KDEL (p < 0.05). C, NE preference of printor was determined by normalizing the NE/ER ratio of printor in HeLa or SH-SY5Y cells to the corresponding NE/ER ratio of KDEL in the same cells. Data represent mean ± S.E. from at least three independent experiments.

