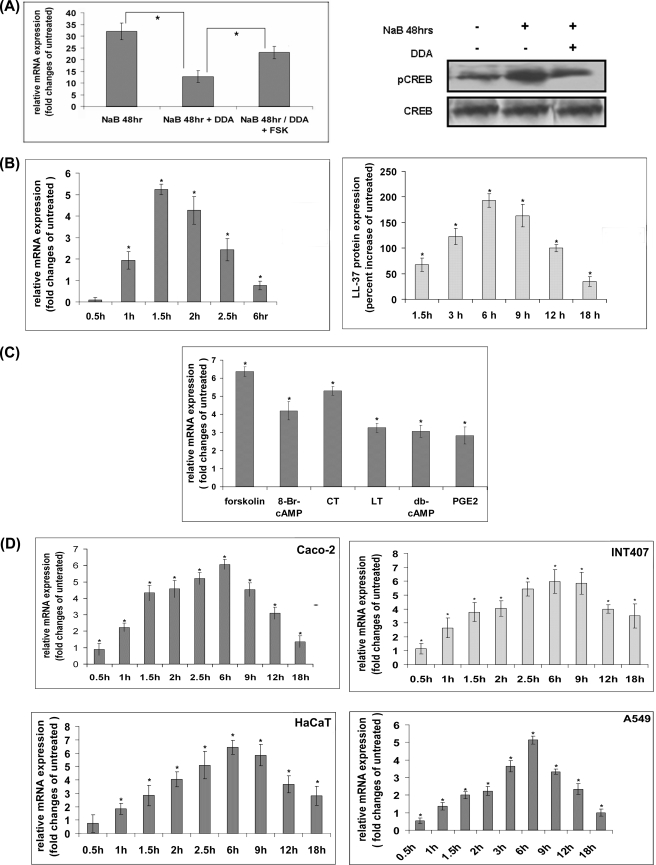
FIGURE 1.
Induction of cathelicidin expression by cAMP. A, 1-day post-confluent HT-29 cells were treated with NaB with or without 2′,5′-DDA for 48 h. A separate set of cells treated with both the agents was subsequently stimulated with FSK for 1.5 h. Left panel, cathelicidin mRNA expression was analyzed in triplicate samples by qRT-PCR and data presented as mean (±S.D.) relative (GAPDH normalized) expression in the treated cells compared with that in the untreated cells. Right panel, Western blot analysis with the cells treated as above using phospho-CREB (pCREB) and CREB (total) antibodies. B, HT-29 cells were stimulated with FSK for different durations. Left panel, cathelicidin mRNA expression in triplicate samples was analyzed by qRT-PCR, and data are presented as in A in the stimulated compared with the unstimulated cells. Right panel, ELISA showing LL-37 protein expression (mean ±S.D.) in the FSK-stimulated compared with the unstimulated quadruplicate samples. C, qRT-PCR analysis of cathelicidin expression in the HT-29 cells stimulated with different cAMP analogs or exogenous or endogenous activators of the cAMP signal transduction pathways for 1.5 h. D, cathelicidin mRNA expression in the epithelial cells of diverse origins stimulated with FSK for various durations was analyzed by qRT-PCR. The experiment was done in triplicate and data presented as in B. Each of the above data is representative of three independent experiments.

