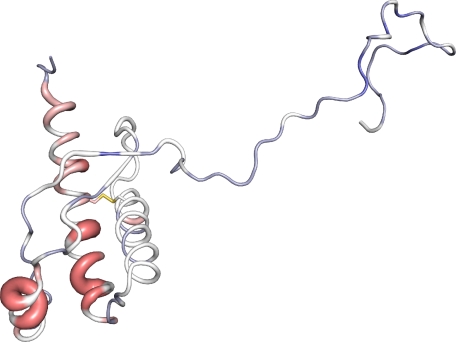
FIGURE 4.
Cα chemical shift changes in β-PrP between 5.2 and 3.5 m urea displayed on the three-dimensional structure of PrPC (6, 76). Residues that show downfield Cα chemical shift changes, and thus retain α-helicity within β-PrP are colored red, whereas those that are in a more extended conformation are colored from white to blue. The magnitude of the chemical shift changes are also shown by the width of the backbone representation. This figure was prepared using PyMOL (84).

