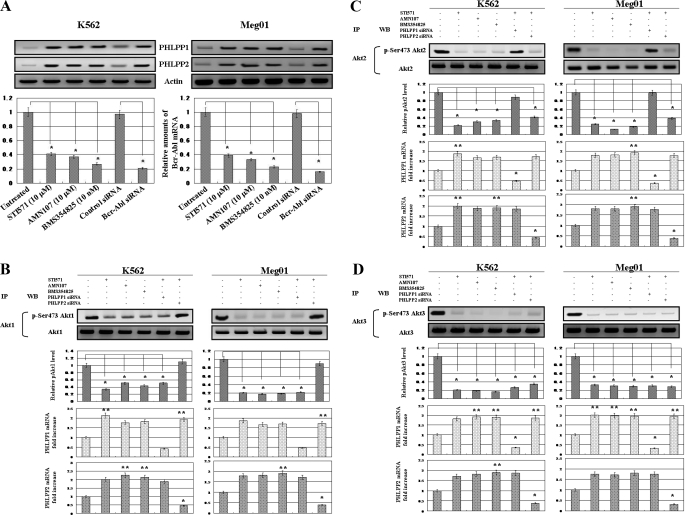
FIGURE 2.
Regulation of PHLPP1 and PHLPP2 protein expression and Akt phosphorylation in CML cells. A, the effects of the Abl kinase inhibitors and Bcr-Abl siRNA on PHLPP1 and PHLPP2 expression were assessed by Western blotting. After 24-h treatment with the Abl kinase inhibitors or 5 days after transfection with control siRNA or Bcr-Abl siRNA, total cell lysates from K562 (upper left) and Meg01 (upper right) cells were prepared and analyzed by immunoblotting. Actin was used as a loading control. Representative blots for two CML cell lines are shown. Relative amounts of mRNAs for Bcr-Abl were measured in K562 (lower left) and Meg01 (lower right) cells. The mRNA expression of Bcr-Abl was assessed by RT-PCR. The expression levels of the target mRNAs were normalized to the relative ratio of the expression of G3PDH mRNA. The results are expressed relative to untreated control set at 1. Each RT-PCR assay was performed at least three times, and each bar represents the mean of S.D. of three independent experiments. *, p < 0.01 compared with untreated control cells. B, C, and D, after 24-h treatment with the Abl kinase inhibitors (STI571 (10 μm), AMN107 (10 μm), and BMS354825 (10 nm)), Akt isoforms were immunoprecipitated from untransfected K562 and Meg01 cells and from K562 and Meg01 cells 5 days post-transfection with PHLPP1 siRNA or PHLPP2 siRNA. Immunoprecipitates (IP) were analyzed by Western blot (WB) analysis with Akt isoform-specific antibodies and phosphorylated Akt isoform-specific antibodies. Actin was used as a loading control. Representative blots from two CML cell lines are shown. The upper bar graph represents the effect of the Abl kinase inhibitors or siRNA knockdown of PHLPP1 and PHLPP2 on Akt1, -2, and -3 phosphorylation. Each phosphorylated Akt (pAkt) isoform normalized to each total Akt isoform was expressed relative to the untreated control set at 1. Relative amounts of mRNAs for PHLPP1 and PHLPP2 were measured in K562 and Meg01 cells. The mRNA expression of PHLPP1 and PHLPP2 was assessed by RT-PCR. The expression levels of the target mRNAs were normalized to the relative ratio of the expression of G3PDH mRNA. The results were expressed relative to untreated control set at 1. Each RT-PCR assay was performed at least three times. Each bar represents the mean of S.D. of three independent. **, p < 0.05; *, p < 0.01 compared with untreated control cells. p-Ser473, phosphorylated Ser-473.

