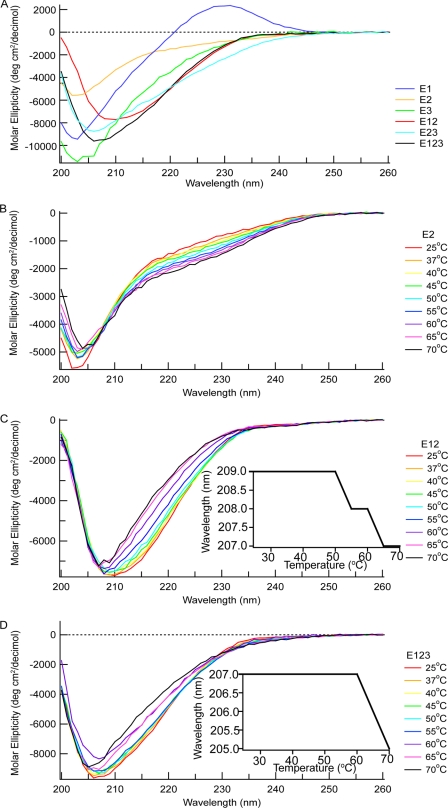
FIGURE 2.
Far UV CD of E1, E2, E3, E12, E23, and E123. A, spectra of the six proteins at 25 °C. B–D, spectral changes of E2 (B), E12 (C), and E123 (D) upon heating. Insets in C and D are changes in wavelengths of minima of E12 and E123 as a function of temperature. The buffer with 10 mm Tris, 150 mm NaCl, 2 mm CaCl2, pH 7.5, was used for far-UV CD experiments.

