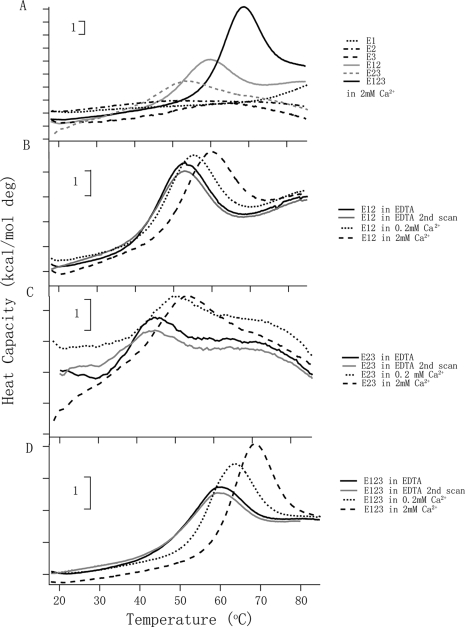
FIGURE 3.
DSC of E1, E2, E3, E12, E23, and E123. A, melting curves of E1, E2, E3, E12, E23, and E123 in 2 mm Ca2+. B, E12 is in different Ca2+ concentrations; the protein in EDTA is shown as solid lines, in 0.2 mm Ca2+ as dotted lines, and in 2 mm Ca2+ as broken lines. C, E23 in the three conditions of Ca2+ concentrations. D, E123 in the three conditions of Ca2+ concentrations. B–D, the repeat scan of the sample in EDTA is shown in gray to illustrate reversibility of the transition. Similar reversibility was found for the other samples. More analyses of the experimental data are in Table 2. The vertical bars indicate 1 kcal/mol degree.

