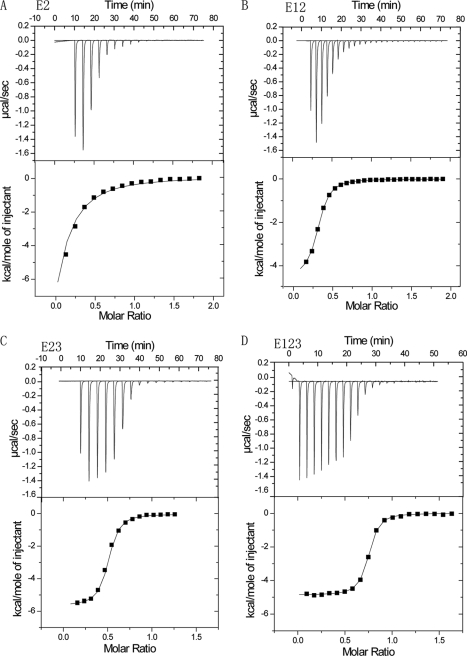
FIGURE 4.
ITC of Ca2+ binding. CaCl2, 3–5 mm, was added repeatedly at 25 °C to sample cells containing E2 (A), E12 (B), E23 (C), or E123 (D). Top, calorimetric trace for titration; bottom, plot of the net heat change as a function of the molar ratio of Ca2+ to protein. The fitted binding sites were <1, ranging from 0.2 for E2 to 0.7 for E123. More analyses of these data are in Table 3.

