FIGURE 4.
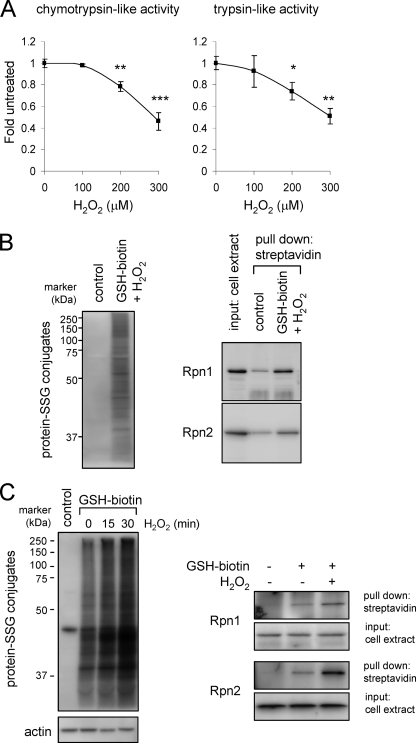
Detection of GSS-Rpn1 and GSS-Rpn2 adduct formation in H2O2 exposed HEK 293 cells. A, cells were incubated without or with H2O2 for 60 min and then chymotrypsin-like (left panel) and trypsin-like (right panel) activities determined. Means ± S.D. are shown. Each experiment was repeated in triplicate. *, p < 0.05; **, p < 0.01; or ***, p < 0.001. B, cell extracts of HEK 293 cells were incubated with or without GSH-biotin and H2O2, and then biotin-GSS-protein conjugates precipitated using streptavidin-agarose followed by SDS-PAGE. Representative Western blots show GSS-protein adduct formation (left panel) and Rpn1 and Rpn2 levels before (input) and after precipitation with streptavidin agarose (right panel). Two additional experiments provided similar results. C, HEK 293 cells were loaded or not with GSH-biotin and then incubated with H2O2 for 15 or 30 min. The cell extracts were analyzed using non-reducing PAGE and Western blot analysis with streptavidin-HRP or after pull down of biotin-GSS-protein adducts with streptavidin-agarose. Representative Western blots show total GSS-protein conjugates (left panel) and GSS-Rpn1 and GSS-Rpn2 adducts (right panel). Two additional experiments provided similar results.

