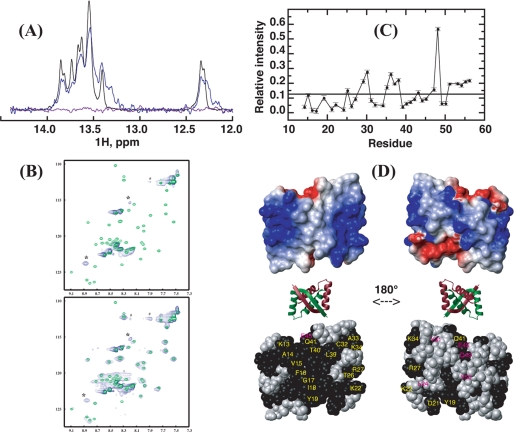
FIGURE 7.
Interaction of SvtR and a 17-bp oligomer (17m) derived from the promoter region of the gp08 gene followed by NMR. Spectra were recorded at 25 °C with buffer D. A, imino region of the one-dimensional 1H spectrum of 17m DNA alone (black), and in the presence of SvtR dimer at a molar ratio of 1:1 (blue) or 1:2 (violet). B, superpositions of the 1H-15N HSQC spectra of SvtR dimer alone (green) and in the presence of the 17m DNA (blue). The molar ratio of protein dimer:DNA was 1:1 (top spectrum) or 6:1 (bottom). *, resonances that do not match the frequencies of isolated SvtR are indicated; #, noise ridge spurious signal; +, folded arginine side-chain signal, their 15N positions in the spectra are different because isolated protein and SvtR:17m spectra were acquired with different spectral widths; C, relative intensity (RI) of the 1H-15N HSQC signals of free SvtR signals in the presence of 17m (3 dimers per DNA molar ratio) and of isolated SvtR as a function of residue number. A threshold value was arbitrarily drawn at 0.12 RI. RI values are given in arbitrary units. Signals of residues 3–12, which showed high apparent RI values (1.7–7.2) are not displayed, because their intensities in the protein-DNA mixture were due to both free and bound protein. In D: top, surface electrostatic potential of SvtR best structure (blue = positive charge, red = negative charge); middle, ribbon diagram of the structure of SvtR to show the orientation of the surface representations; bottom, CPK representation of SvtR best structure. All the atoms of the residues with amide relative intensities lower than 0.12 are shown in black. Labels are shown only for one monomer in yellow for residues on the β-sheet face or in magenta for residues that are not exposed on the β-sheet face.

