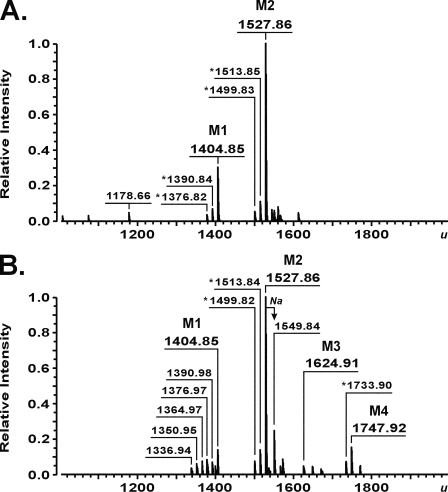
FIGURE 2.
Charge deconvoluted ESI FT-ICR mass spectra in negative ion mode of LPS molecules isolated from E. coli strains KPM56 (A) and KPM125 (B). M1, lipid IVA (1404.85 u); M2, lipid IVA modified with a P-EtN group (1527.86 u); M3, Kdo-lipid IVA (1624.91 u); M4, Kdo-lipid IVA substituted with a P-EtN group (1747.92 u). Peaks presumably representing molecules with variations in acyl chain length (Δm = 14.02 u) are labeled with an asterisk. The molecule corresponding to triacylated lipid A (1178.66 u) is probably an artifact produced during LPS isolation, since it is not consistent with a known pathway intermediate.

