FIGURE 5.
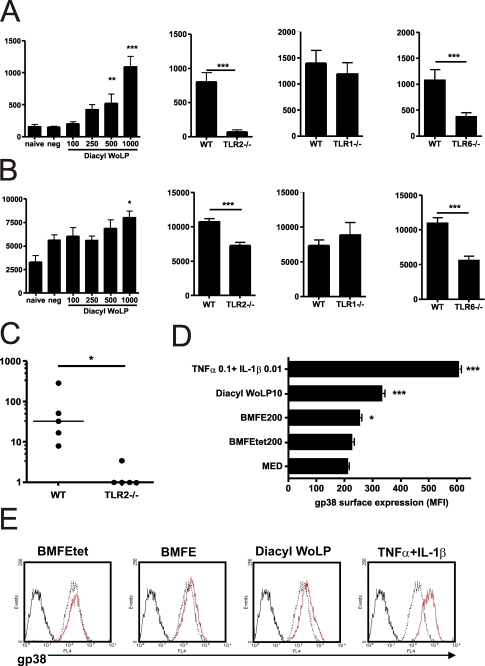
Diacyl WoLP induces filarial disease manifestations. A, Diacyl WoLP induces neutrophil infiltration following intra-corneal injection into WT mice in a dose-dependent manner (left-hand panel). Bars are mean ± 1S.E. neutrophil numbers from groups of three animals. Doses given are in nanograms/ml. Neutrophil accumulation is impaired in TLR2−/− or TLR6−/− but not TLR1−/− mice following a 1000 ng/ml intra-corneal injection (right-hand panels). Bars are mean ± 1S.E. neutrophil numbers from groups of three animals. B, corneal haze is induced by Diacyl WoLP in a dose-dependent fashion in WT mice (right-hand panels). Bars are mean ± 1S.E. corneal haze from groups of three animals. Doses given are in nanograms/ml. Corneal haze is significantly reduced in TLR2−/− and TLR6−/− mice but not TLR1−/− mice following a 1000 ng/ml dose. Significance differences between Diacyl WoLP inoculation and negative control or between WT and specific KO are indicated: ***, p < 0.001; **, p < 0.01; and *, p < 0.05. C, Diacyl WoLP induces a systemic TNFα response in plasma 6 h following a 50-μg intraperitoneal injection in WT but not TLR2−/− mice. Bars indicate median TNFα levels from groups of five animals. Significant difference is indicated: **, p < 0.01 (Mann-Whitney non-parametric test). D, Wolbachia- and Diacyl WoLP-dependent gp38 up-regulation on lymphatic endothelial cells. THP-1 cells (human monocytic cell line) were stimulated with 200 μg/ml BMFE or BMFEtet or 10 μg/ml WoLP for 24 h. Monocyte supernatants were harvested and added to HMVECdly at a 1:3 dilution. Recombinant human TNFα (100 ng/ml) and IL-1β (10 ng/ml) were added to HMVECdly as a positive control. Surface expression of gp38 was determined by flow cytometry after 16 h. Differences in MFI of anti-gp38 labeling in HMVECdly exposed to TNFα and IL-1β or supernatants from treated THP-1 cells (treatments given are in micrograms/ml) were compared with unstimulated THP-1 supernatant exposed HMVECdly. Bars are mean ± 1S.E. MFI from triplicate labeling reactions. Significant differences between treatment and medium control are indicated: ***, p < 0.001; *, p < 0.05. All data are representative of two independent experiments. E, histograms represent fluorescent intensity of anti-gp38-stained HMVECdly exposed to unstimulated THP-1 supernatant (dashed line) or stimulated THP-1 supernatants/positive control (red lines). The isotype control is plotted as a black solid line.

