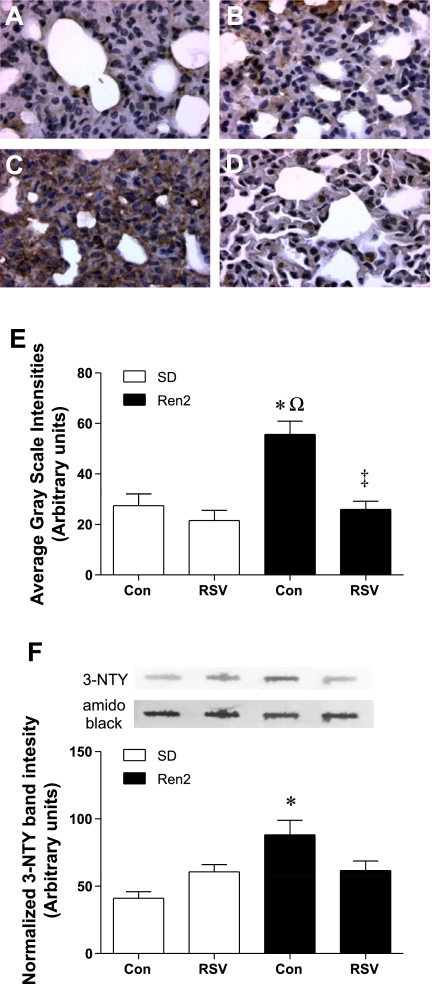
Fig. 6.
Effects of RSV on pulmonary 3-nitrotyrosine (3-NTY) in SD and Ren2 rats. A–D: representative micrographs of lung sections from SDC (A), SDR (B), R2C (C), and R2R (D) rats stained for 3-NTY. E: average grayscale intensity (±SE) of the 3-NTY immunostaining (n = 4). F: representative lanes from a slot blot of whole lung homogenates probed for 3-NTY and normalized to total protein by amido black staining are shown over a histogram quantifying 3-NTY (n ≥ 4). Significant differences were determined via ANOVA with a Tukey-Kramer post hoc test. *P < 0.05, SDC vs. R2C; ΩP < 0.05, SDR vs. R2C; ‡P < 0.05, R2C vs. R2R.

