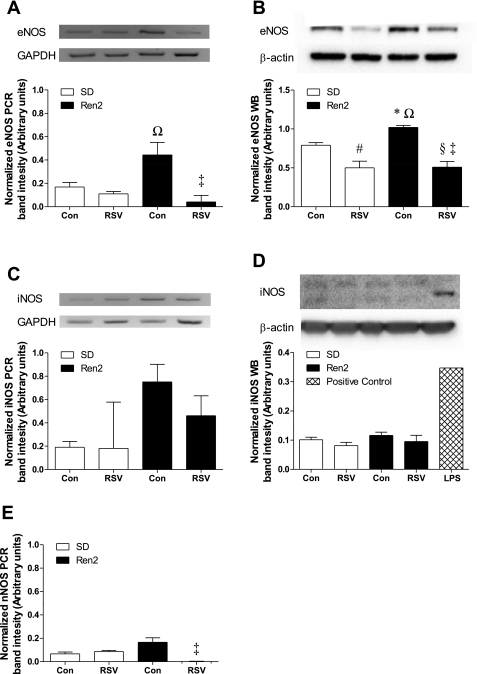
Fig. 8.
Effects of RSV on pulmonary NO synthase (NOS) isoform expression in SD and Ren2 rats. A–E: pulmonary mRNA and protein were examined via RT-PCR (A, C, and E) and Westen blot analysis (B and D), respectively, for endothelial NOS (eNOS; A and B), inducible NOS (iNOS; C and D), and neuronal NOS (nNOS; E). All analyses were conducted on the same gel/blot; representative blots are shown above each histogram except for nNOS, which was barely detectable, and aligned to match the labels for the histogram (n ≥ 3). Significant differences were determined via ANOVA with a Tukey-Kramer post hoc test. *P < 0.05, SDC vs. R2C; #P < 0.05, SDC vs. SDR; §P < 0.05, SDC vs. R2R; ΩP < 0.05, SDR vs. R2C; ‡P < 0.05, R2C vs. R2R.

