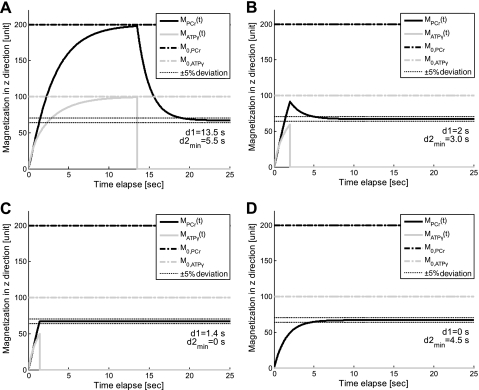
Fig. 2.
The numerical analysis of governing Eqs. 5–8. Time dependence of PCr and ATP-γ magnetizations in z direction during MST pulse sequence (see in Fig. 1) is plotted with different presaturation delays: 13.5 s (A), 2 s (B), 1.4 s (C), and 0 s (D). Dotted lines indicate ±5% deviations from theoretical Mss,PCr value as given by Eq. 9, from which the minimal saturation time d2,min is defined, such that MPCr at the end of saturation process just lies between those lines. Simulation parameters are as follows: kf = 0.44 s−1, T = 4.5 s, T
 = 1.5 s, and M0,PCr/M0,ATPγ = 2. The simulation demonstrated that the values of Mss,PCr and T
 are independent of d1. See text for definition of terms.

