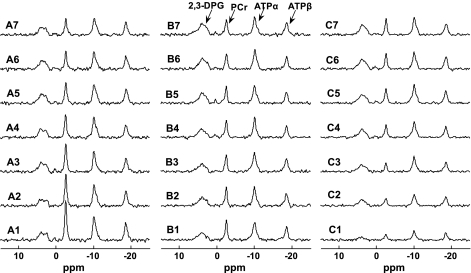
Fig. 6.
Typical progressive saturation spectra from same heart with different presaturation delays of 7 s (A), 2 s (B), and 0 s (C). Spectra 1–7 (bottom to top) represent prolonged saturation on ATP-γ of 0.5, 1, 1.5, 2.5, 4, 6, and 8 s, respectively. Total data acquisition times for A, B, and C are 14.5, 7.5, and 5.6 min, respectively. These spectra confirmed the simulation results as shown in Fig. 2.

