Fig. 8.
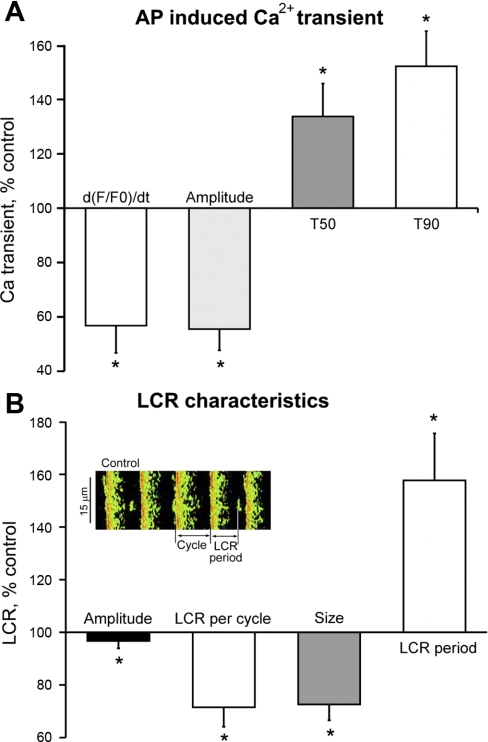
A: average (n = 10) changes in AP-induced Ca2+ transient characteristics in the presence of CCh. d(F/F0)/dt, maximum rate of rise of the Ca2+ transient measured as F/F0 fluo 3-AM fluorescence; T90, transient duration at 90% of transient amplitude; T50, transient duration at 50% of transient amplitude. In control: d(F/F0)/dt = 0.032 ± 0.002 s−1; amplitude = 1.46 ± 0.08 F/F0; T90 = 264.4 ± 11 ms; T50 = 100.2 ± 3 ms. B: average (n = 10) change in LCR characteristics induced by CCh. In control: LCR amplitude = 1.1 ± 0.18 F/F0; LCR number per cycle = 1.02 ± 0.1; LCR size = 6.9 ± 0.7 μm; LCR period = 351 ± 22 ms (*P < 0.05). The method used to define LCR period and LCR cycle length is illustrated in the inset of B. The cycle length is the time between 2 successive AP-induced Ca2+ transients, and LCR period is measured as time from the preceding Ca2+ transient upstroke to the maximum rate of rise of subsequent LCR (*P < 0.05).

