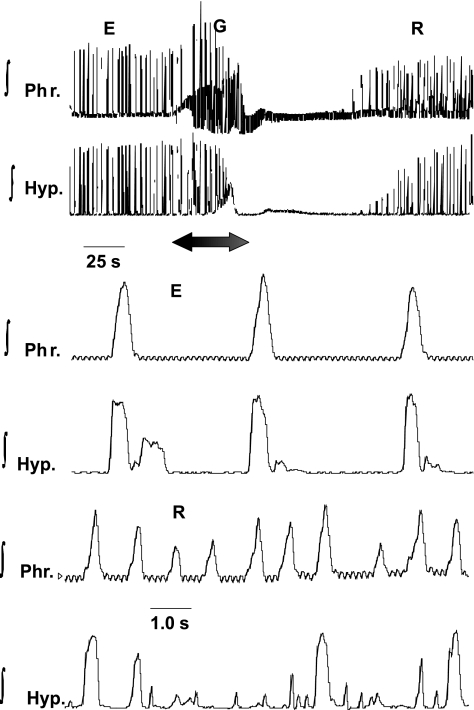
Fig. 2.
Alterations in ∫Phr and ∫Hyp nerves in E, ischemic-induced gasping (G), and recovery (R). Recordings in E are shown in top tracings and, on expanded time scale, on bottom tracings. Note greater rate of rise of ∫Hyp than ∫Phr discharge in E. During period designated by arrow, perfusion was terminated, and G was induced (see Fig. 3 for expanded recordings of E and G). Upon the recommencement of perfusion, a sustained apneic period intervened before neural activities recommenced (R). Note on the expanded tracings during this early R phase that the frequency of phrenic bursts had increased, and hypoglossal discharge was of low amplitude in some cycles, missing in others, and, finally, occurred in neural expiration. Small, high-frequency oscillations, which are visible on ∫Phr activity, represent the electrocardiogram.

