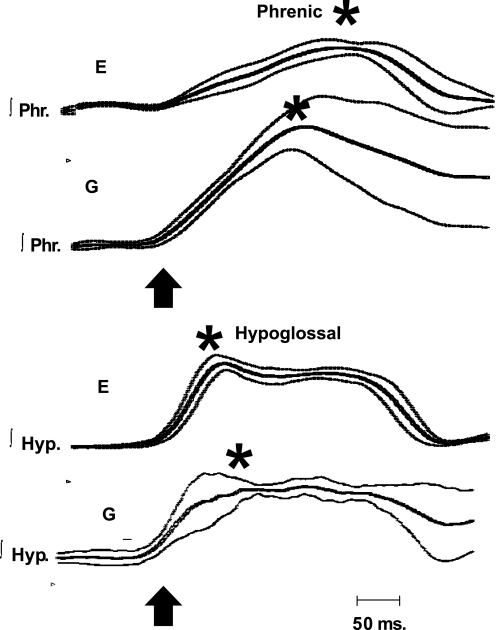
Fig. 6.
Average tracings of ∫Phr and ∫Hyp activities during E and G. Tracings of Fig. 5 have been averaged, and results are shown by thick line, with standard errors shown by thinner lines. Arrow designates the start of the burst, and asterisk designates peaks. Note that peak of ∫Phr discharge occurred much earlier in the gasp than eupneic inspiration, whereas peak of hypoglossal discharge was slightly later in the gasp than in E.

