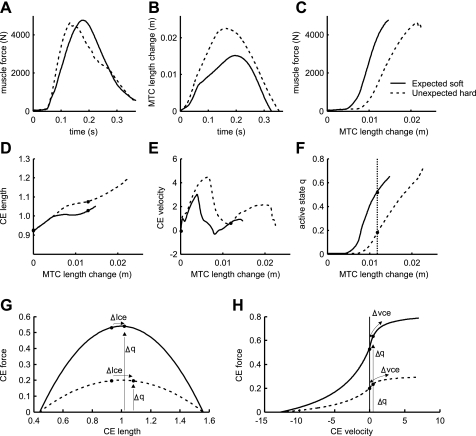
Fig. 7.
Time histories of m. soleus force (A), MTC length change (B), and muscle force vs. MTC length change (C). D: contractile element (CE) length normalized to optimal length. E: CE velocity. F: active state q vs. MTC length change of m. soleus. Data in D–F are plotted as a function of MTC length change to highlight the effect on effective muscle stiffness shown in C. Force-length (G) and force-velocity (H) relationships for the active states q indicated in F are shown. These correspond to an MTC length change of 0.012 m relative to touch down. The effects of changes in CE length (Δlce) and CE velocity (Δvce) on muscle force are indicated along the force-length and force-velocity curves, whereas the effect of change in q (Δq) on muscle force is indicated by the height of the curve. Note that force rise as shown in C mainly depends on the rise in q (F).

