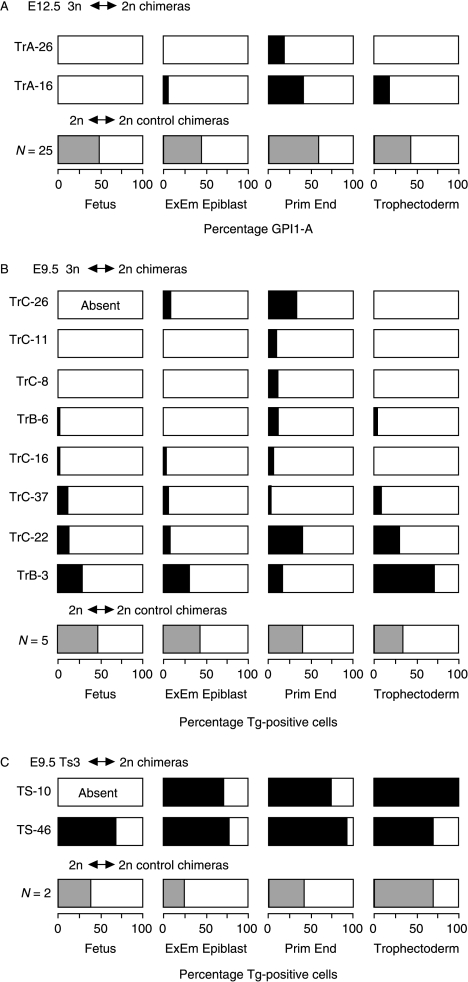
Figure 3.
Diagrammatic summary of the composition of the fetus and three extraembryonic lineages in (A) E12.5 3n↔2n chimeras, (B) E9.5 3n↔2n chimeras and (C) E9.5 Ts3↔2n chimeras. Shaded regions represent the percentage of Tg-positive cells in the different lineages (shading is black for individual 3n↔2n and Ts3↔2n chimeras and grey for means of 2n↔2n control chimeras). The extraembryonic epiblast values are means of amnion and visceral yolk sac mesoderm; primitive endoderm values are means of visceral yolk sac endoderm and parietal endoderm; E12.5 trophectoderm values are means of the placenta (predominantly placental trophoblast) and the trophoblast overlying Reichert's membrane; E9.5 trophectoderm values are means of separate estimates for the placental trophoblast, placental trophoblast giant cells and trophoblast giant cells overlying Reichert's membrane (Tables 3–5). Triploid↔2n chimera TrC-25 is not included because it was damaged and so not analysed. Abbreviation: ExEm, extraembryonic.

