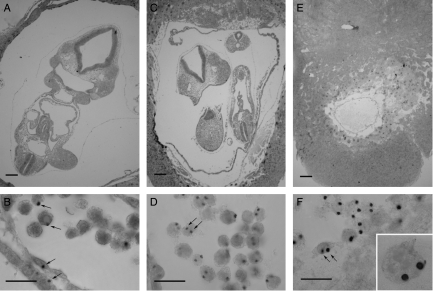
Figure 4.
Trisomy-3↔diploid chimeras. Histological sections and DNA in situ hybridisation of (A and B) E9.5 2n↔2n control chimera TS-42, (C and D) E9.5 Ts3↔2n chimera TS-46 and (E and F) E9.5 Ts3↔2n chimera TS-10. Arrows show (B) examples of 2n (Tg/−) nuclei with single hybridisation signals and (D and E) examples of Ts3 (Tg/Tg/−) nuclei with two hybridisation signals. Inset in F shows trophoblast giant cell at the same magnification. Two hybridisation signals are not seen in all sections of Ts3 nuclei. Scale bars=200 μm (A, C and E) and 20 μm (B, D and F).

