
Figure 5. Similar surface phenotype of splenic cDCs from WT, IFN-β-/- and IFNAR-/- mice.
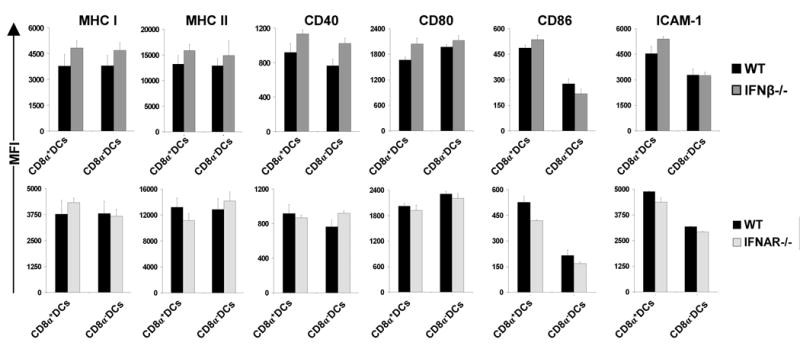
Splenocytes isolated from C57BL/6 WT, IFN-β-/- or IFNAR-/- mice were stained and gated on the basis of CD11c, CD11b, CD8α and B220 on two populations of cDCs. Graphs show MFI (Mean Fluorescence Intensity) values for expression of indicated markers. No major differences between DCs from WT, IFN-β-/- and IFNAR-/- mice were observed. MFI of each marker was measured for at least five mice per group. Data are representative of 5 independent experiments.