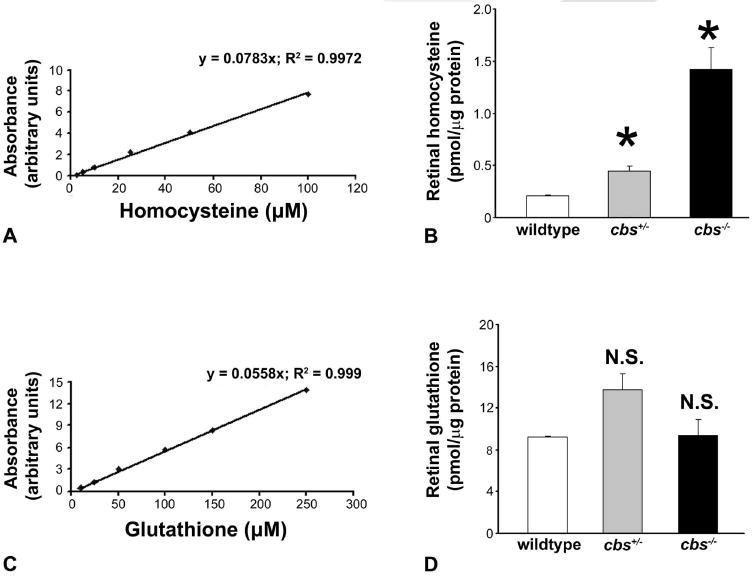
Figure 1.

Quantification of homocysteine and glutathione in neural retina. Neural retina was subjected to HPLC analysis. (A) Standard curve used for derivation of homocysteine content; (B) homocysteine content. (C) Standard curve used for derivation of glutathione content; (D) glutathione content. *Significantly different from wild-type mice (P < 0.05); NS, not significantly different from wild-type (n = 12 wild-type, 6 cbs+/−, and 4 cbs−/− mice).
