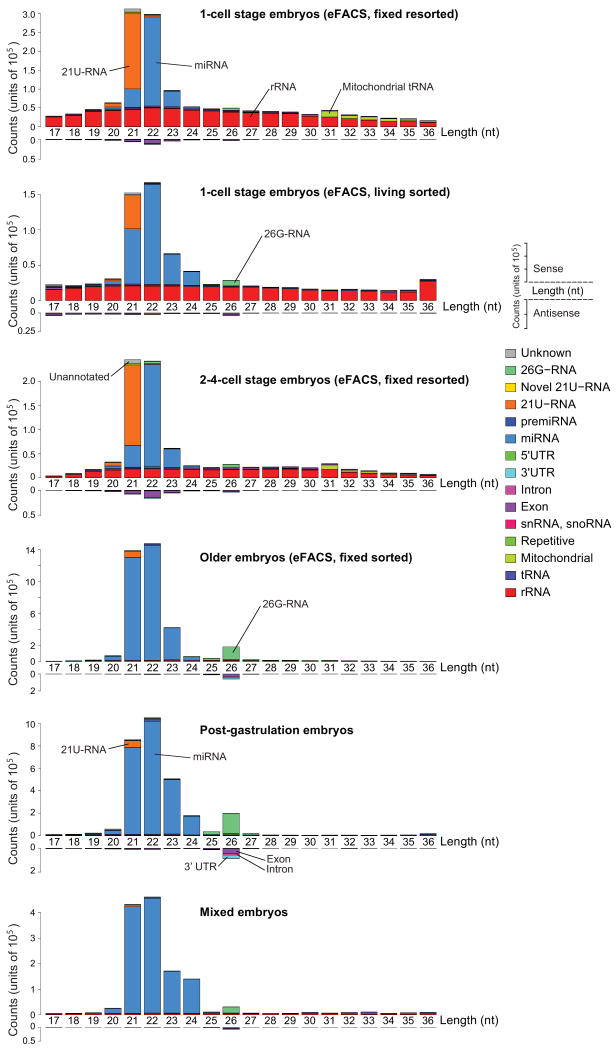
Figure 5.
Differential expression between and within almost all classes of small RNAs during embryogenesis.
Small RNA length distribution at different developmental stages. The relatively small number of sequencing reads that mapped anti-sense to known transcripts is plotted below the horizontal axis. Many of these reads are most likely endogenous siRNAs (see text). The transcript length profiles for all other reads show distinct characteristic features for the different small RNA classes. tRNAs and rRNAs have uniform length distributions while the length of miRNAs and 21U-RNAs peak around 22 and 21 nucleotides, respectively. ∼60% all known miRNAs are already detected in the one-cell embryo. In the one-cell embryo, reads mapping to rRNAs are highly expressed, drop in expression in the two-to-four-cell embryos, and are virtually absent in older embryos. 21U-RNAs are very abundant in the early embryo. 26G-RNAs were most highly expressed in older embryos. The older embryo samples are dominated by miRNAs, followed by 26G-RNAs and reads of length 26 nt that mapped anti-sense to known mRNAs. The live sorted one-cell stage sample, which is contaminated with older embryos, exhibits features from the early embryo samples (21U-RNA, rRNA) as well as the older embryos (26G-RNA).

